This was not a 'live' project, but using a training data set provided by IKON.
Using RocDoc, an appropriate Vp,Vs, and Density (Rho) log set was created and combined with suitable mineral and fluid sets to investigate the potential for various seismic inversions to differentiate lithology and fluid fill from the seismic data.
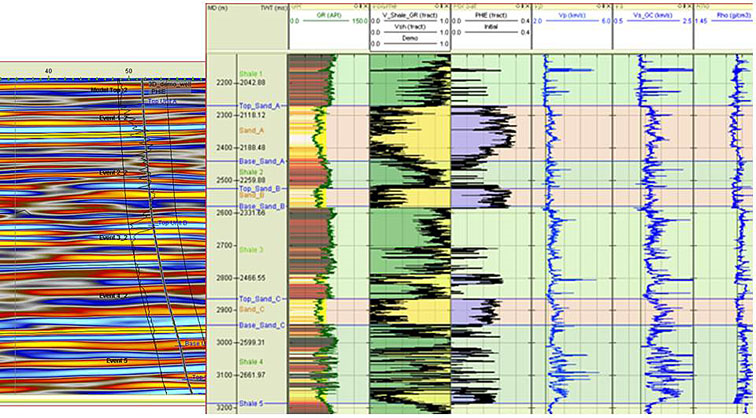
The log suite of the solitary exploration well and an example of the seismic response of
the sand-shale series.
The original log suite did not contain a recorded Vs log.
Therefore, after creating the Vshale log from the measured Gamma ray log,
the shear-wave velocity log of the water saturated composite lithologies shown here was approximated from the average of the arithmetic and harmonic
means of the constituent pure lithology Vs, calculated from the Vp-Vs relationships published by Greenberg and Castagna.
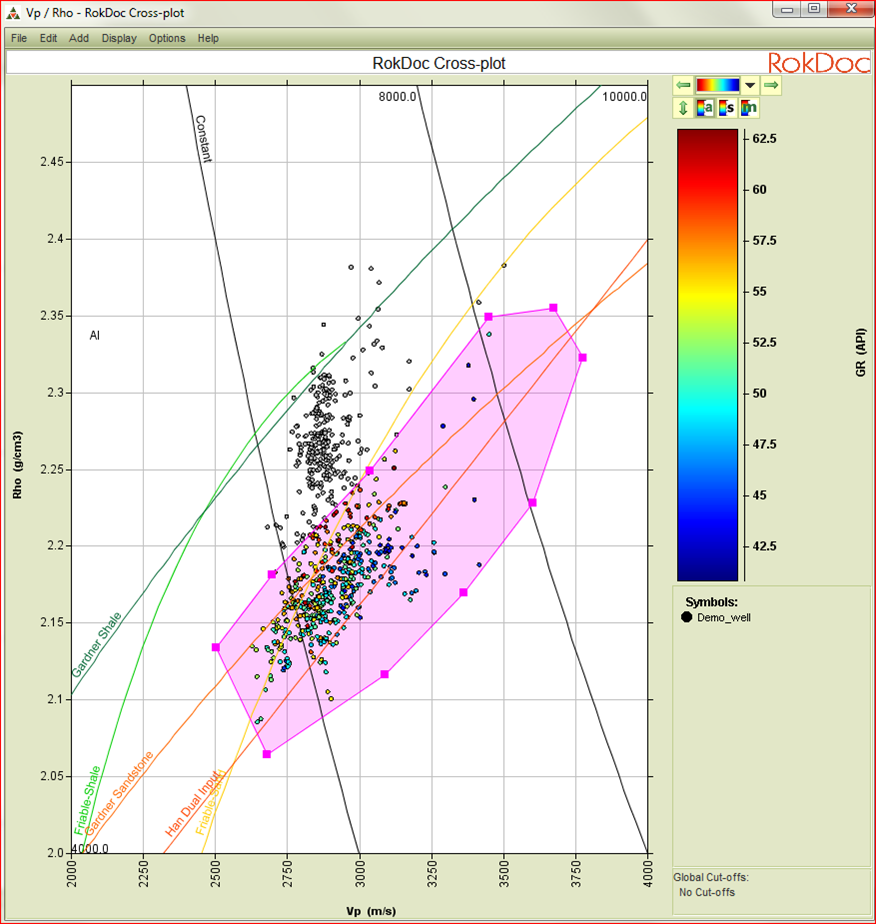
Cross plot of Vp against Rho for the top reservoir sand interval.
To get a first pass look at the possible change of seismic response I could expect for various fluid fills, and to get an idea how useful AVO modelling would be,
I did some 'blocky' modelling over averaged intervals that approximated to the resolution of the seismic data.
To exclude shaley levels from the sandstone intervals it was convenient to use a cross plot. The one shown here is for the thickest, topmost sand unit of the reservoir.
Crossplotting Vp against Rho shows shale points deviating away from the sand trend which we want to capture for our end-member blocky model.
Using an inclusive polygon the shale measurements were easily excluded, to give better sand averages.
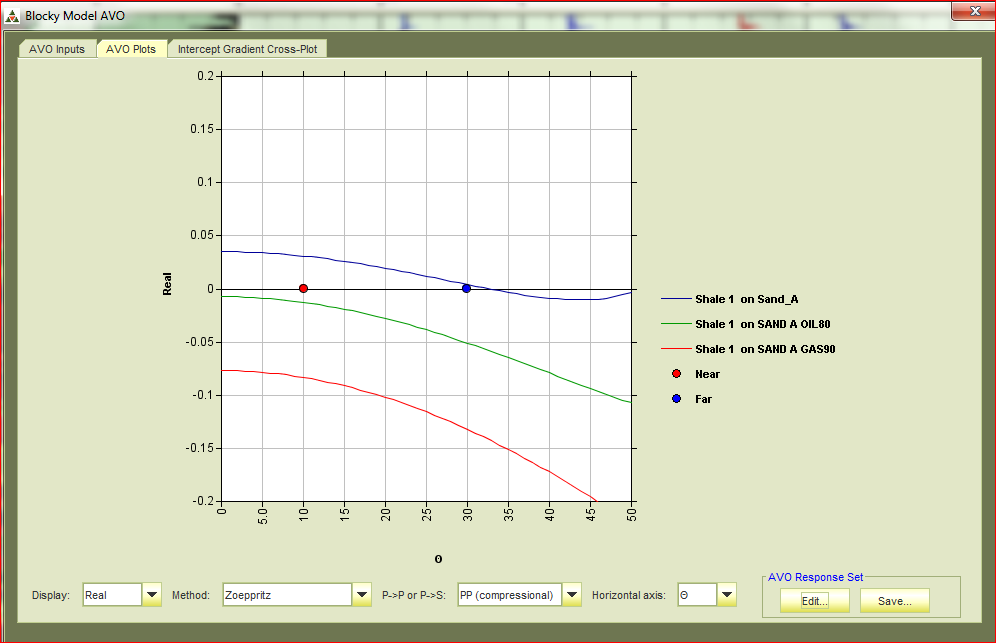
AVO plot of the top reservoir sand for the water case and various fluid substitutions.
The expected AVO response on all the reservoirs was calculated within the RocDoc software using the full Zoeppritz equation. Here I am showing the results for the thickest,
top reservoir sand and the overlying shale (blue line).
With reference to the topmost diagram you can see that the sands have a slightly faster Vp than the overlying shales and plot as a weak Class IIP AVO response,
meaning we would expect the event to be a weak positive event on the near traces but a weak negative polarity on the far traces.
The results for an 80% oil saturation and a 90% gas saturation were established after fluid substitution, using the Gassman equation.
Here, the effect of the water is backed out to establish dry rock moduli and the changes in rock compressibility and bulk density are then calculated for the specified fluid fills.
You can see here, and with reference to the diagram below, that the hydrocarbon injection lowers the density and Vp of the sand, relative to the overlying shale.
In the case of 80% oil saturation (green line) the top reservoir would be expected to be a class II AVO response, weak negative polarity events increasing in amplitude on the far traces.
In the case of 90% gas saturation (red line) we could expect the classic class III (bright spot) response of strong, negative polarity events, increasing in amplitude on the far traces.
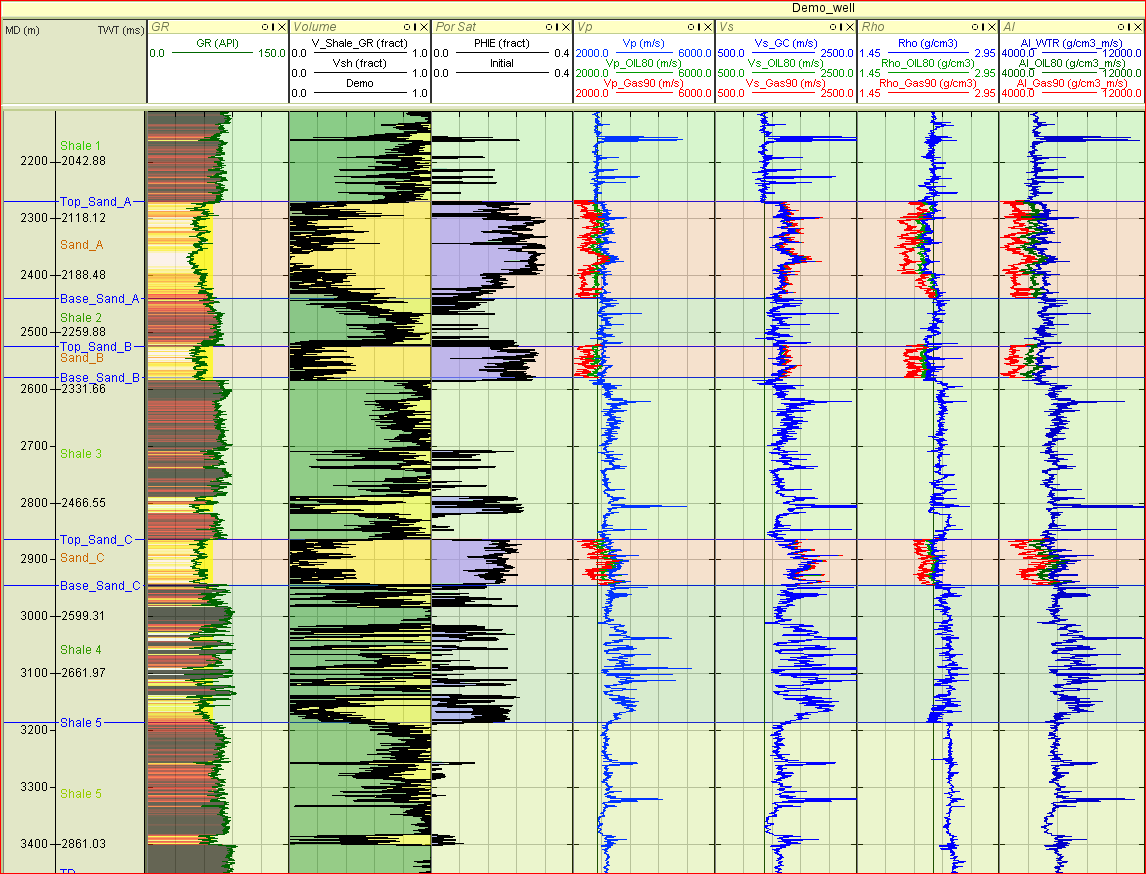
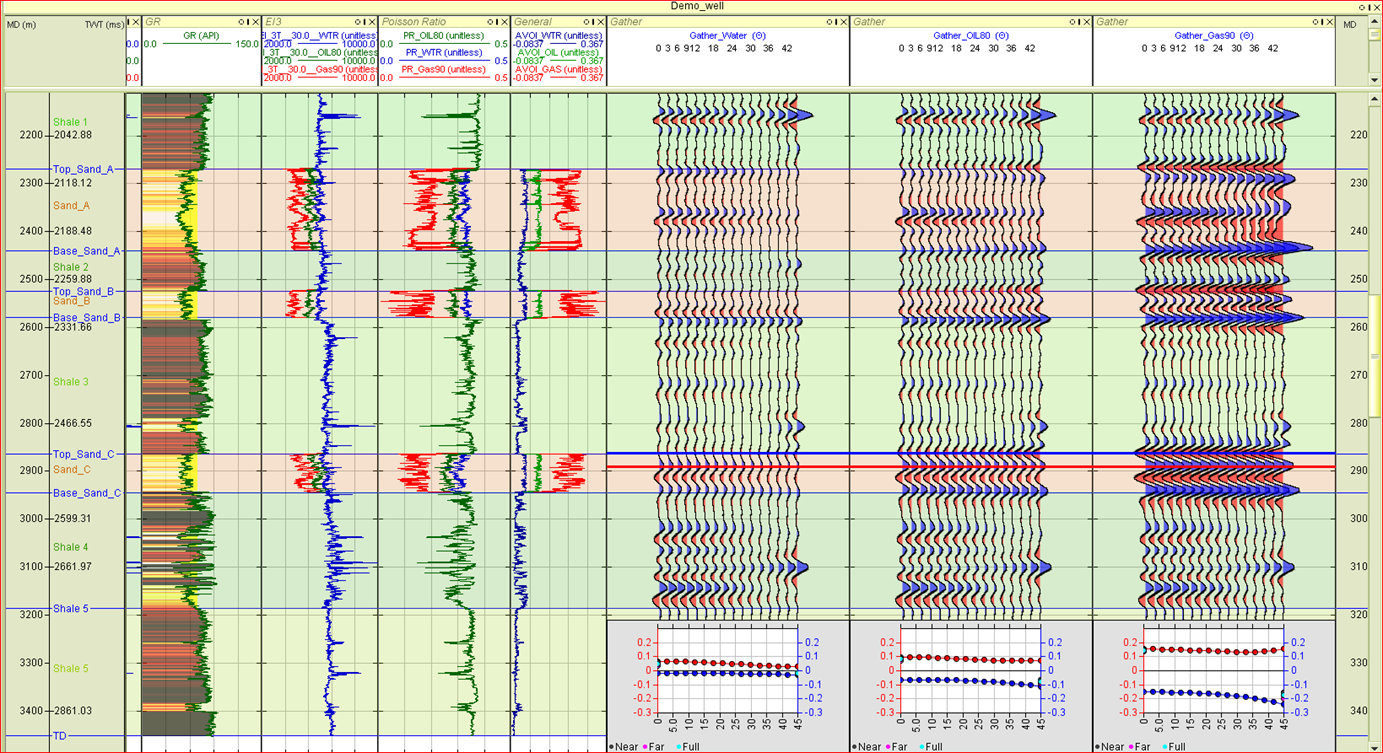
Fluid substitutions on the log data.
Fluid substitution, using the same Gassman Dry Rock modelling routines, was then applied to the log data and the results are shown here.
The resulting logs were then used to compute synthetic gathers for each fluid case, so they could be compared to the recorded gathers.
The logs show how much the density and Vp have been reduced by the injection of hydrocarbons, as discussed above.
The Acoustic Impedance (AI) log on the right of the diagram shows quite good discrimination between the various fluid fills, but AI alone would not be a unique discriminator.
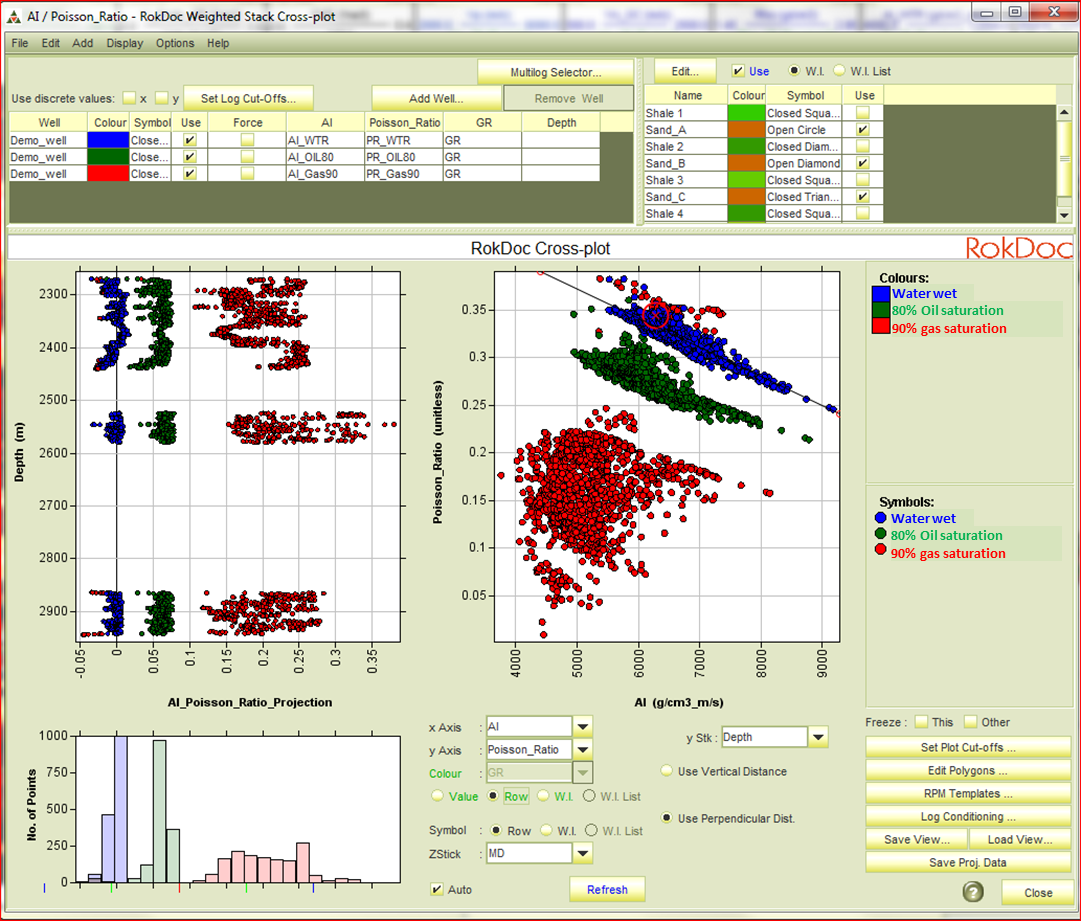
Multiwell crossplot and AI-PR projection showing discrimination of fluid fill.
Using the same Vp, Vs and Rho datasets established previously for each of the fluid types, and their equivalent mineral and fluid sets, various log elastic properties, including Poisson's Ratio (PR),
LambdaRho, MuRho and a 3 term Elastic Impedance (EI), have been derived.
After examining the ability of various elastic properties for fluid and lithology discrimination, Acoustic Impedance (AI) versus Poissons's Ratio(PR) was chosen. Their relationship is demonstrated by the multi well crossplot shown here.
The data for the 3 fluid types is plotted for each of the 3 reservoir levels. In AI-PR space there is clear discrimination between the 3 fluid types.
The shale lithology can also be discriminated, but is not shown here.
In the right-hand crossplot a projection line, aligned along the water saturated points is drawn. Projections (rotations) of the well points to that line are plotted in the left-hand AI-PR projection.
This clearly shows that such a projection is clearly differentiating between water, oil and gas sands.
Elastic inversions displayed as log curves.
The AI-PR projected data is plotted as a log curve here, under the AOI (AVO Impedance) heading(right-hand log track).
The curve shows how the fluid types are differentiated but also shows how the shale versus sands can also be differentiated using this same elastic attribute.
Using the one exploration well, the above study shows how a meaningful attribute could be derived from the seismic volume, helping to de-risk future wells in the area.
Back to Project Summary on the Consultancy page