The licence containing the Faraday prospect was granted as part of the UK's 24th Licencing Round.
The project's task was to get the prospect through the various gate reviews, to be drill ready.
Besides extensive mapping and seismic reprocessing (bringing together 6 separate legacy surveys) which greatly improved the imaging of the prospect,
the nature of the amplitude anomaly which defined the prospect was also investigated. This element of the work is outlined below.
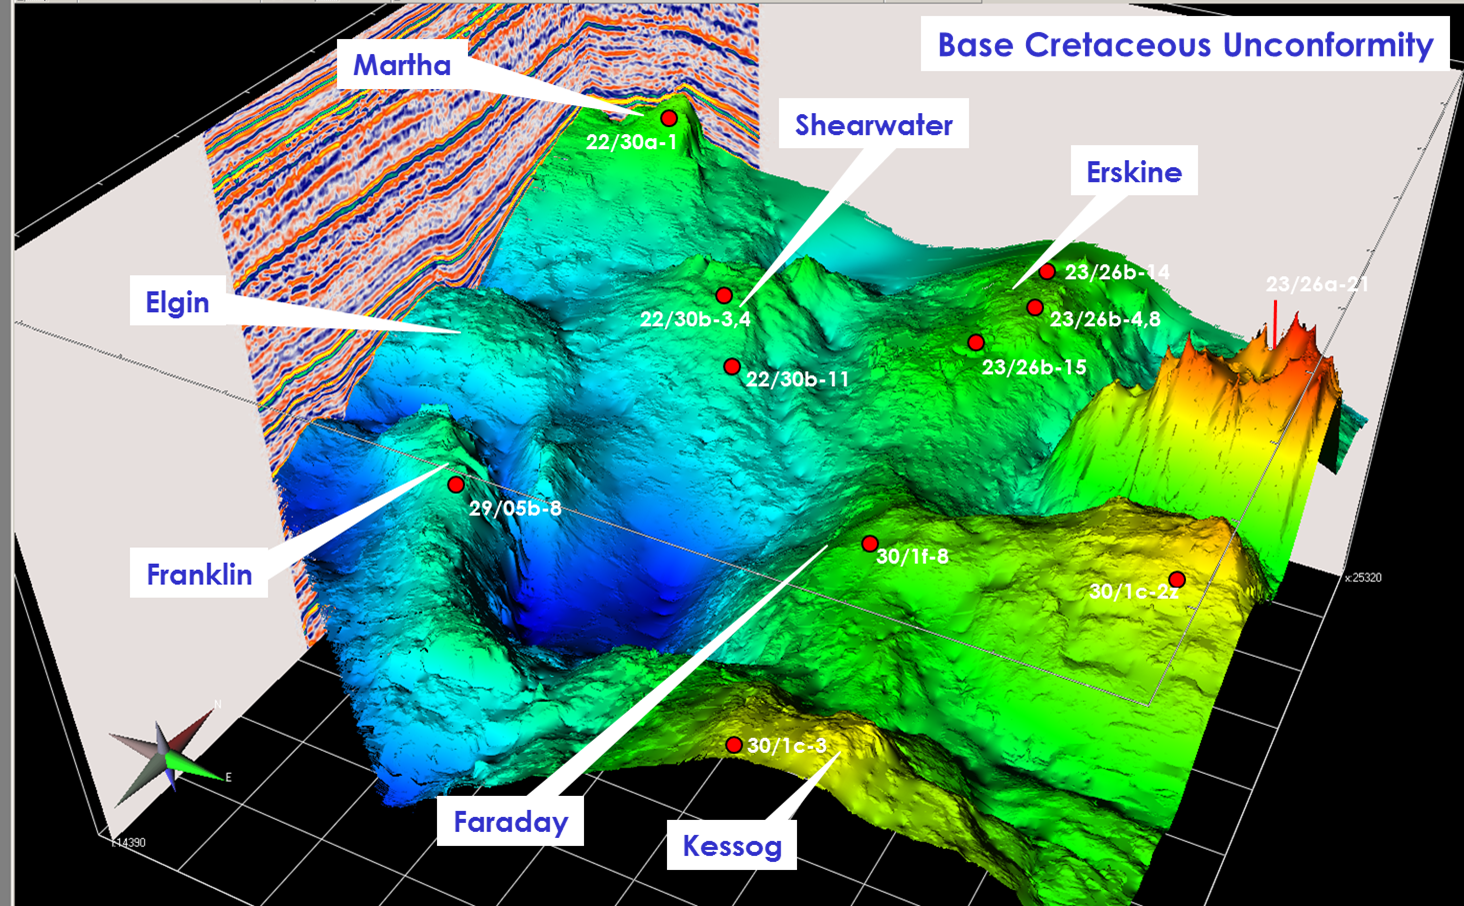
Location of the Faraday prospect on the western flank of the J Ridge.
The Faraday prospect lies in the deep East Central Graben of the UK's North Sea, on the western flank of the J Ridge.
It is close to the HTHP fields of Erskine Elgin Franklin and Shearwater.
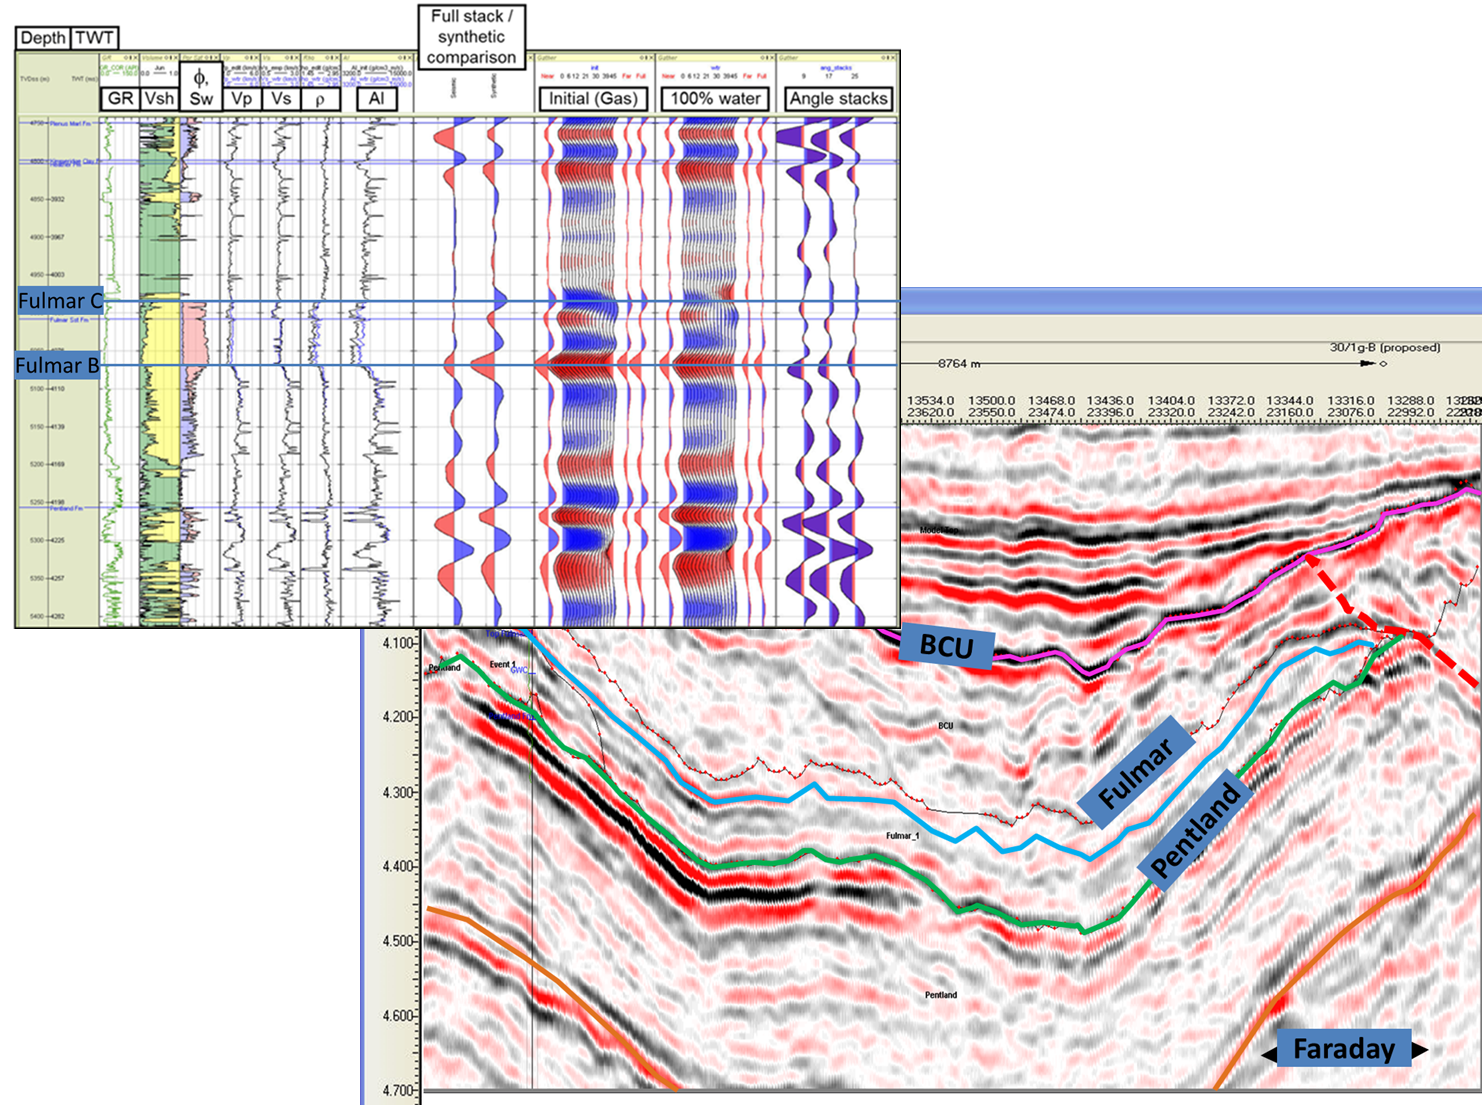
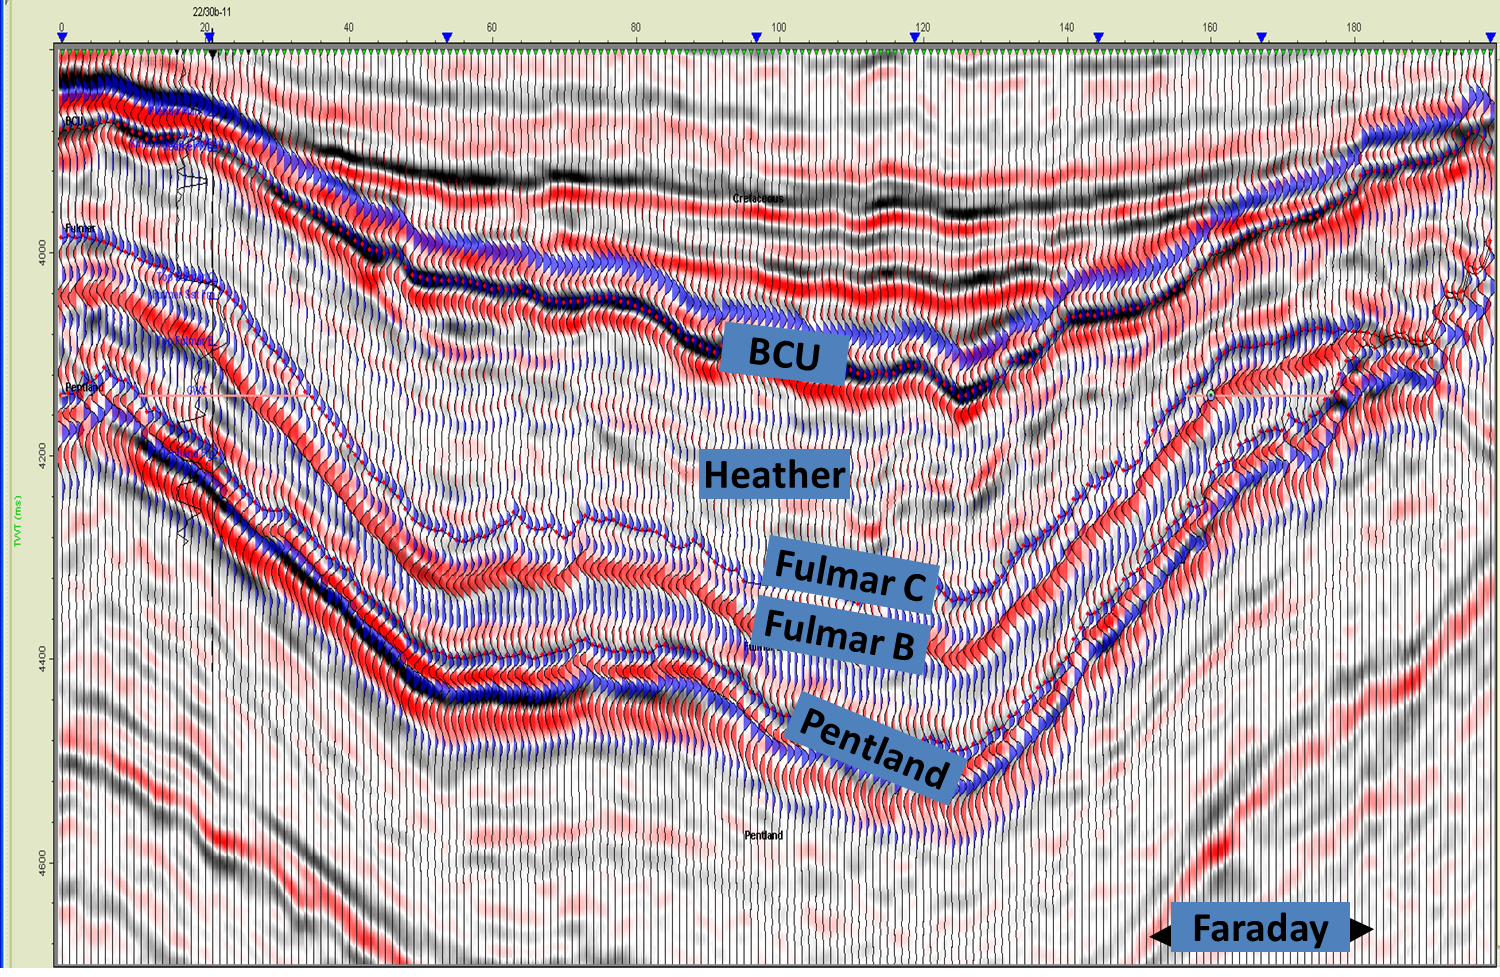
The Faraday prospect and typical log responses from offset wells.
The prospective reservoir is Fulmar sands.
Offset wells show the Fulmar to be divided into a lower, tight sand, Fulmar B, with an average porosity of 20% and an upper, reservoir quality sand with an average porosity of 25%, referred to as Fulmar C.
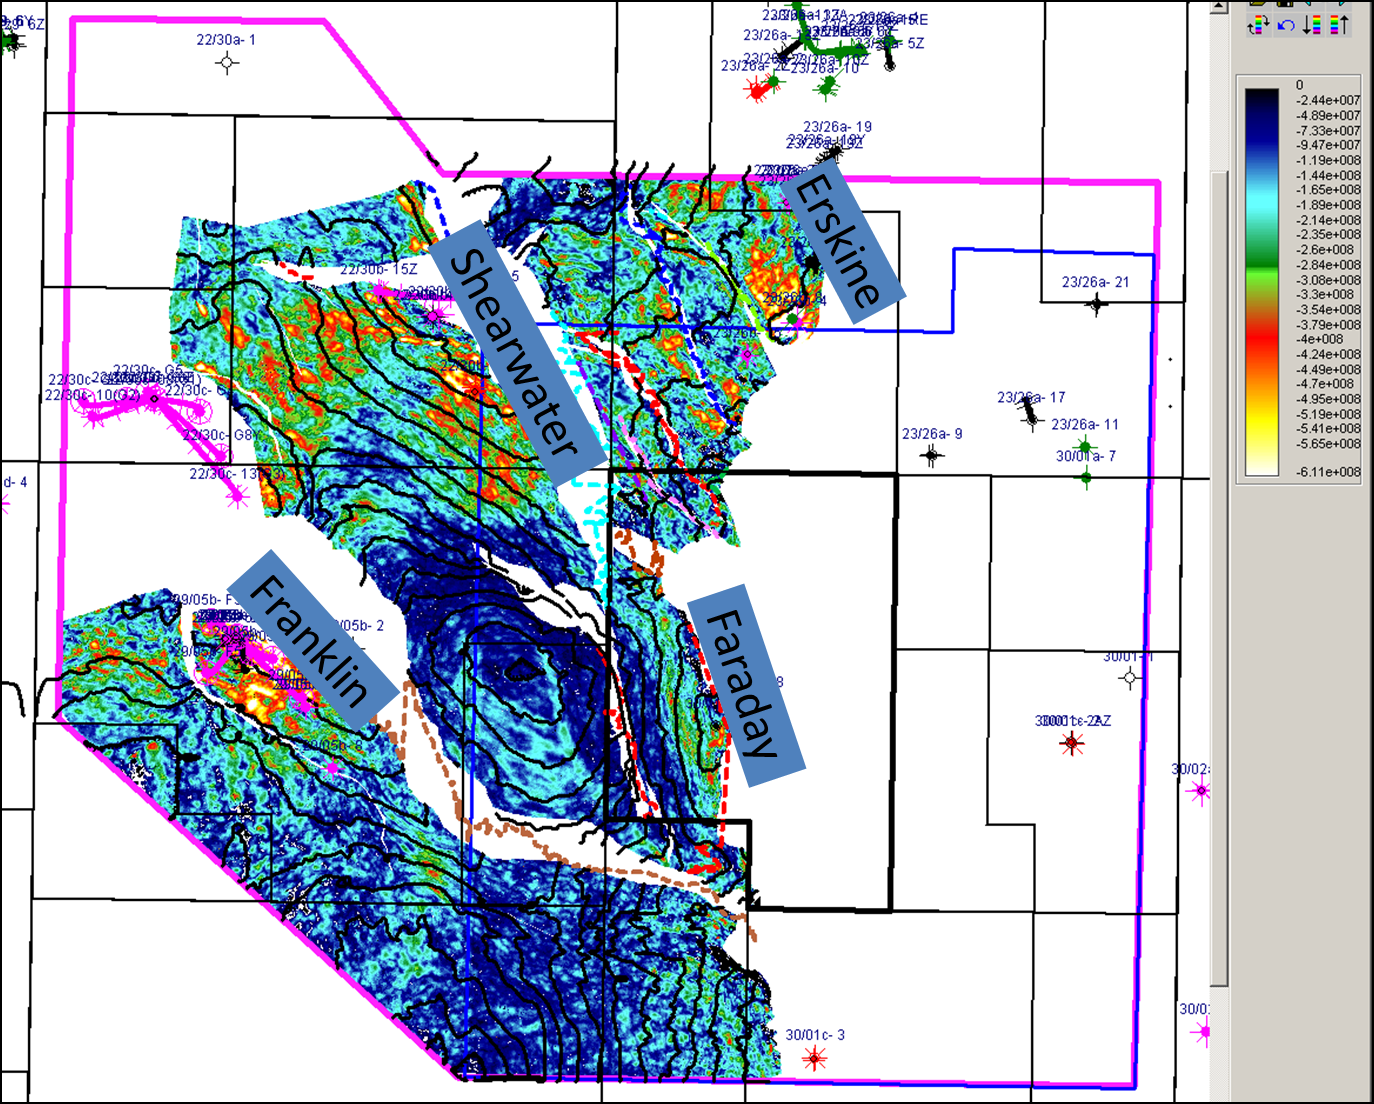
Amplitude variation extracted from the Top Fulmar reflector.
The upper reservoir unit is generally a very weak seismic event but over the Faraday prospect, as well as the nearby fields of Erskine, Shearwater, Elgin and Franklin, it is a strong peak, showing an amplitude anomaly that conforms to the structural contours.
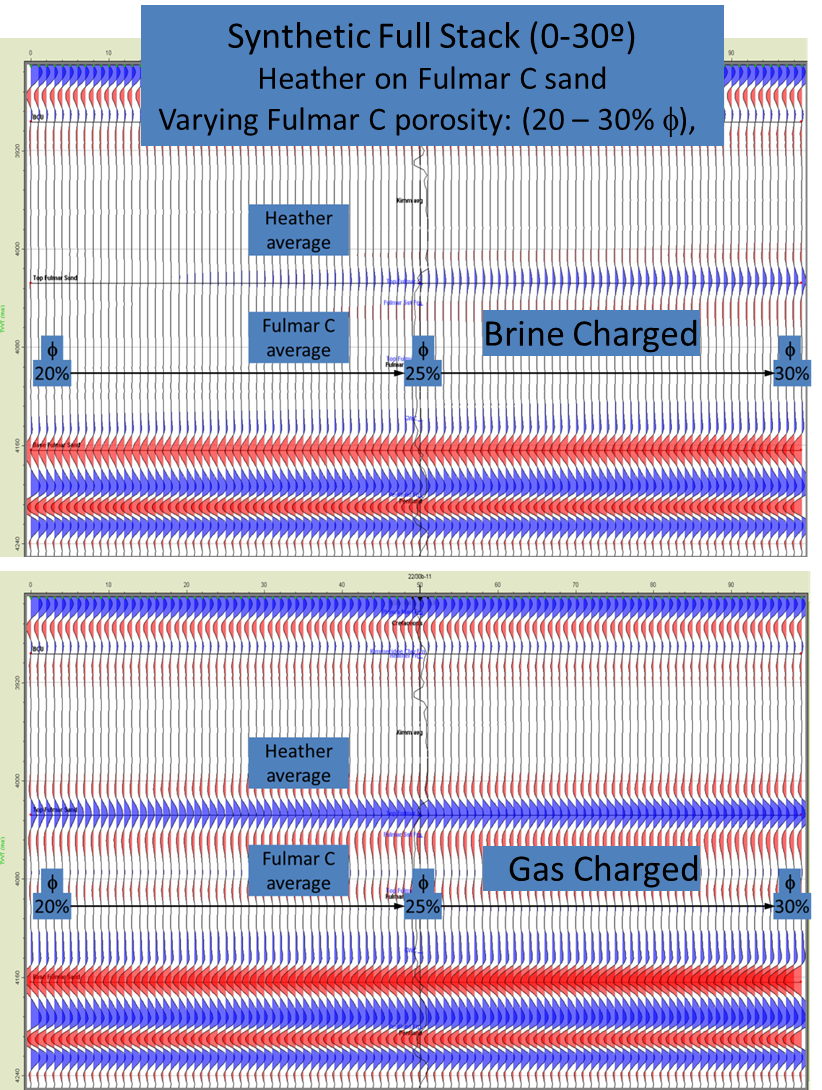
Full offset modelling of Heather Formation on Fulmar C model(by Ikon GeoScience).
Ikon Geoscience created a series of synthetic models constructed by extrapolating the properties of the brine charged well logs of nearby wells, convolving with the extracted wavelet, and then stacking the angle range 0-30.
The porosity was then varied laterally from 5% less than the well values to 5% greater than the well values.
The picture shows the brine charged response using Fulmar C average properties compared to the same model after fluid substitution to 80% gas saturation in the Fulmar layer.
The model confirms that in the case of an interface between Heather and high porosity Fulmar, the seismic response is a weak peak event.
The presence of gas softens the Fulmar acoustic impedance response, therefore increasing the contrast between it and the layer above resulting in a brighter peak.
When the underlying Fulmar B is added (model not shown) there is an increase in impedance, the Fulmar B being marked by a trough reflection.
Adding gas to both layers has a larger effect on the impedance of the upper Fulmar C, because of its higher porosity so the net effect of the gas is to increase the contrast between upper and lower Fulmar, resulting in the amplitude of the top Fulmar B trough also brightening.
Overlay of full offset amplitude model of picked horizons on actual seismic data(by Ikon GeoScience).
Applying this model to actual horizon data, (carried out by Ikon Geocience) gives a good match to the observed Faraday response, where the trough also brightens below the peak.
This gives an acceptable degree of confidence that both high and low porosity Fulmar sands are present at the Faraday prospect and are gas charged.
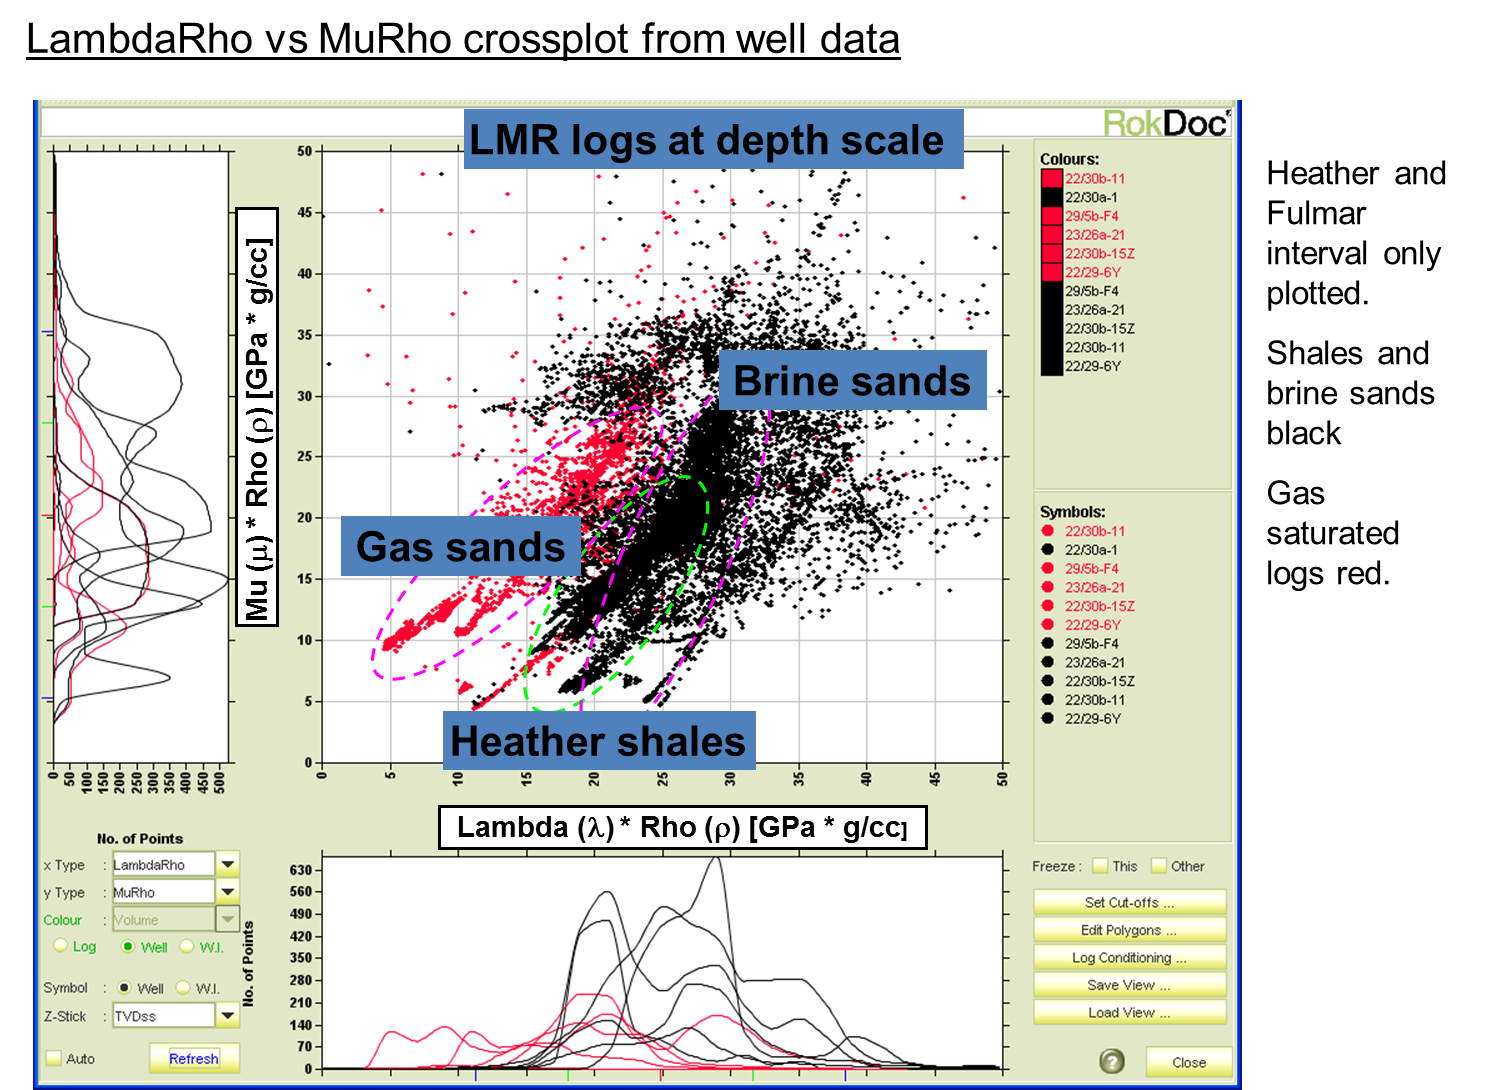
LambdaRho vs MuRho crossplot from offset wells (by Ikon GeoScience).
A number of tests were done to determine if inversion of the angle stacks would aid in the discrimination of fluids and/or lithology at Faraday.
The approach used was simultaneous inversion of the angle stacks (by Ikon Geoscience).
Modelling of well data suggested that elastic inversion for the Lamé coefficients Lambda Rho and Mhu Rho for effective incidence angles up to 30° should be able to determine the presence of sand and discriminate between brine-saturated and gas-bearing sandstones.
However, because of the poor quality of the large angle prestack data there was insufficient discrimination between brine and gas sands on the inversion results.
Part of the problem of getting good quality far offset data is a limitation set by Mother Nature.
The Chalk layer lies close above the reservoir horizon, and because of its high velocity contrast to the overlying and underlying layers, the critical angle at which seismic energy is no longer transmitted as refracted energy is small.
Sinθc = V1/V2
Typical values for the Tertiary at this depth are 2250m/s and for the Chalk 4500m/s thus leaving a critical angle for total internal reflection of 30 degrees.
Back to Project Summary on the Consultancy page