logo

STUART FLETCHER

Consultant Geophysicist

Project Summary

Detailed depth conversion analysis for a Field Equity Determination in the UK's Southern Gas basin.

 HomeConsultancyAbout Us More

On this project I was a member of the client's equity determination team, on the geophysical sub-committee.
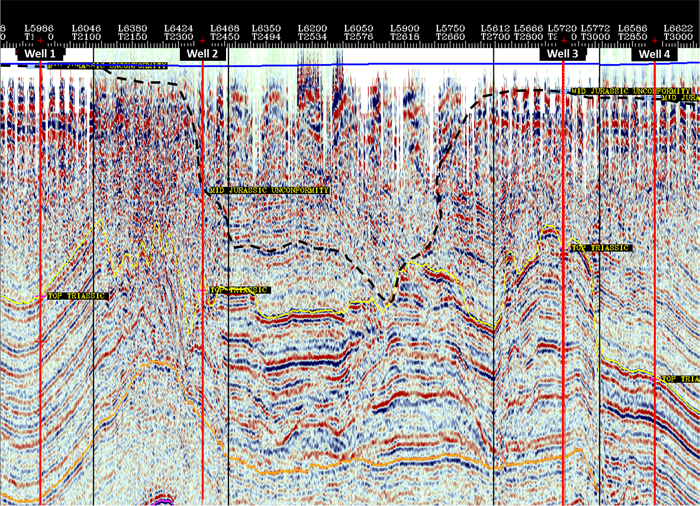
One element of the work was a detailed study of the effects of the overburden's velocity variations and the design of an appropriate depth conversion methodology.
The study allowed the client to enter partner negotiations with a risked assessment of the equity split.

SNS Velocity
Interval Velocity variation for Depth of Burial and the controls on the variation of V0

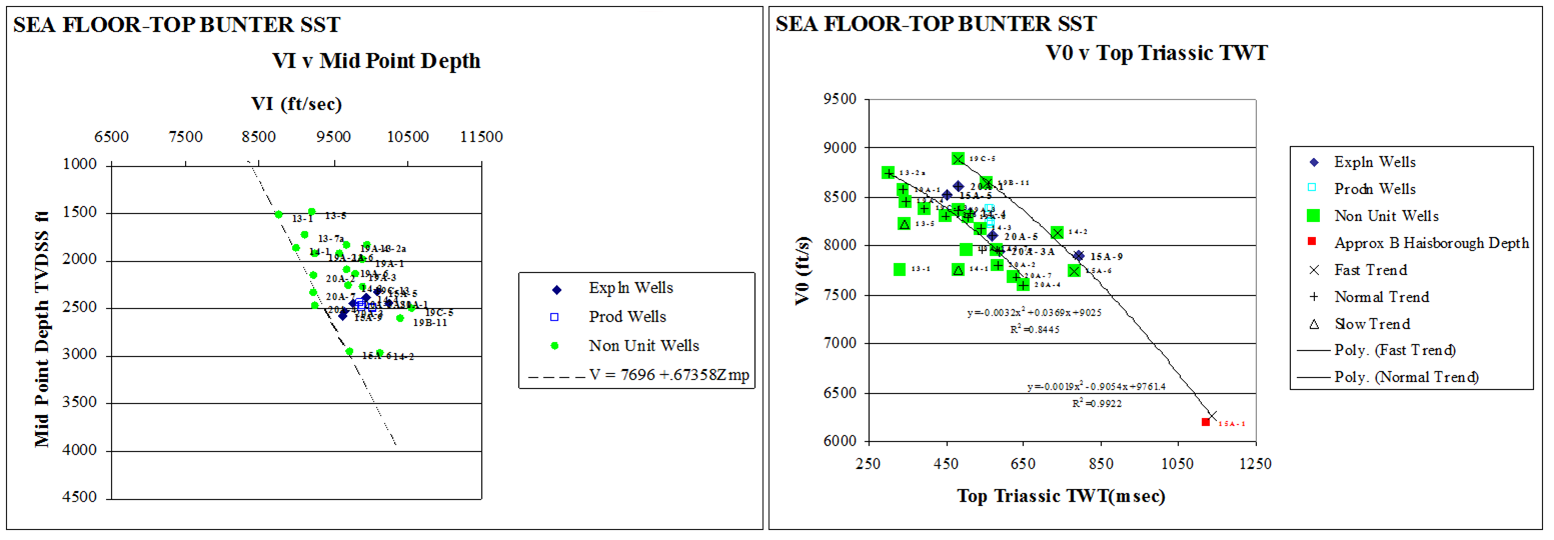
Velocity variations for the post salt were studied in terms of

  1. BURIAL
    Velocity versus Mid Point Depth and Mid Point Time.
  2. BULK GEOLOGICAL VARIATION
    Velocity versus Thickness.
  3. SPATIAL VARIATION
    Velocity versus the Easting and Northing component and Interval velocity maps.
  4. UPLIFT
    A combination of 1 and 3; that is compaction being the predominant affect but subsequently distorted by spatially varying uplift.
Although a multilayer approach was taken, analysing the velocity significant layers of Jurassic and the Haisborough and Bacton Groups separately, an interesting observation can be made looking at the section from the surface to the Bunter Sandstone as a whole.
The plotted function on the left was derived from the complete set of well points with a best fit K value (slope of the V= V0 + K Zmp function) giving the minimum depth error fit. It is plotted in the slowest velocity position on the graph.
SNS Section
A seismic section illustrating the Tertiary filled basin in the centre of the Middle Jurassic inversion zone.

The values of V0 (ie normalised for depth variation), corresponding to each velocity point, have been calculated and plotted against the Top Triassic TWT to give the second graph. The plot shows exactly what you'd expect, that the interval velocity of the Sea Floor to Top Bunter layer decreases as the overlying Jurassic and younger sediments thicken.

The plot also shows, however, that the wells lie on different families of trends, from slow to fast indicating that some other factor also exerts control. What is being shown here is the effect of the Middle Jurassic inversion. All the wells along the fast trend of the second graph have a thick Lias sequence. In the centre of the inversion zone the Lias has been deeply eroded, but subsequent collapse has created a basin that has been filled with the slower velocity Tertiary material. The wells lying along the slower velocity trend all occur within the collapse zone of the Middle Jurassic inversion.

The section shown here to illustrate the collapse zone of the Middle Jurassic inversion, also illustrates the practical problems that are usually encountered in these sorts of studies.
The shallow, and therefore slow velocity, eroded sequences that are the dominant control of the velocity distribution are poorly sampled and imaged. The well sampling and logging start below these key velocity sediments and the seismic dataset is severely muted, leaving low or even zero fold data that cannot be interpreted with great accuracy.
Back to Project Summary on the Consultancy page Button.png