To get a fuller description of this project you can get the abstract of the technical paper
Fletcher, S. [2013] The Impact of Reverse Time Migration on the Evaluation of Mature Southern North Sea Assets. EAEG Conference Workshop, Interpreting the Imperfect Image. here.
Quite a lot of the SNS gas fields have a large disparity between their mapped GIIP and the amount of gas that has been actually produced, the latter tending to be considerably greater.
Notwithstanding the fact that the large pore-volume 'below' the cut-offs used in the GIIP calculation could be contributing some unpredicted pressure support for the gas,
it is also true that a lot of the Permian aged, Rotliegend, structures lie below walls or pillows of Zechstein salt.
The fast velocity, low density salt bends the seismic wavefront to an extent that it is very hard to accurately image, and therefore map, the underlying reservoir, much to every geophysicist's frustration.
Thus, the inaccurate maps of the Rotliegend must also contribute to the discrepancy between the mapped GIIP and the amount of gas produced.
It is not only the image directly below the salt wall that is heavily distorted. Geological variation in the rim synclines adjacent to the salt also cause seismic wavefront disruption, giving an incorrect image in depth.
This is the case with this project, where having recognised that the contour of the Rotliegend structure was dominated by the footprint left by imperfect imaging through the overlying salt wall and its rim syncline,
I set out to try and improve the accuracy of the image with Reverse Time Migration.
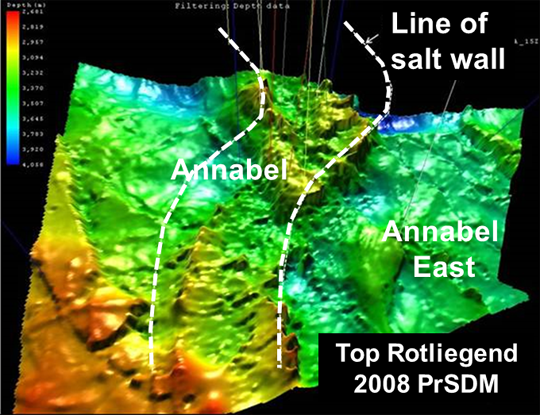
Distortion of the Rotliegend structure caused by having to image it through
the overlying salt wall
Bearing in mind that away from the salt domes the Rotliegend structures in the UK's Southern Gas Basin trend linearly northwest-southeast it is easy to suspect, when looking at the adjacent picture, that
the sinuous 'half pipe' shape is simply an artefact of the imperfect velocity model through the overlying salt layer.
It is also worth asking the question, could the Annabel East structure be a continuation of the Annabel block and the intervening syncline simply be a result of a flawed velocity layering through the salt wall's rim syncline.
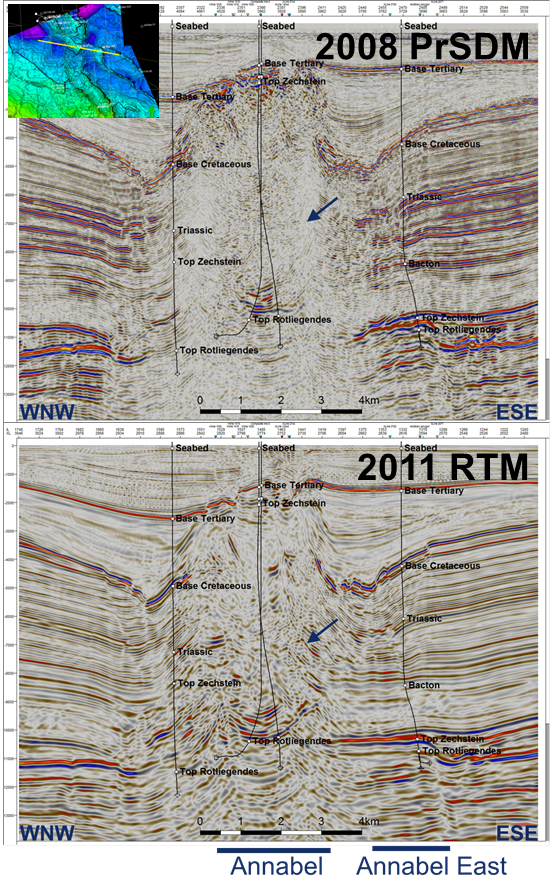
Comparison seismic sections showing the differences in imaging between the
2008 PrSDM and the 2011 RTM across the Annabel East structure.
Looking at the 2008 section crossing from Annabel East to Annabel it does look very suspicious that the Rotliegend dips directly below a rim syncline which is structurally related to the growth of the dome, and therefore post-Rotliegend in age.
After exhaustive studies showing that the processing velocities within the rim syncline where an order of magnitude faster than what would normally be expected from the rate of increase of velocity with depth, as derived from all the offset wells, it was decided to reprocess the data.
Besides the problems of the velocity model within the rim syncline, the failing of the 2008 PrSDM image is that there are no reliable sub-salt reflectors underneath the salt dome flanks.
This may be due to poor illumination or the limitation of the ray-tracing-based Kirchhoff algorithm to correctly position reflected energy. In the Kirchhoff method only one travel path/time pair can be migrated and so,
in the case where a reflection time can have several travel path options, multi path energy is incorrectly migrated, leading to incoherent noise on the seismic section.
Therefore Reverse Time Migration was used, to try and correctly migrate the multipath energy from the steeply dipping structures in the underside of the dome, where the wavefield might fold over on itself.
The big limitation on the success of this sort of algorithm in improving the reflection migration quality is the quality of the available data. Here we are reprocessing data shot in the 1990's, with maximum offsets in the order of 3km.
Published modelling studies carried out on similar salt domes in the Central Graben indicate that the prism waves bouncing from the underside of the dome might eventually reach the recording cable at the surface at offset distances in the order of 6 to 10 km.
Despite the limitation of having to deal with legacy data, the results of the RTM give a vast improvement in the representation of the subsurface structure, especially along the flanks of the dome, beneath the rim syncline.
The suspect syncline between Annabel and Annabel East has been replaced with a structural high that conforms to the expected geological model. Replacing a low with a high has obvious economic consequences.
The arrow on the 3D image of the Top Rotliegend structure on the right, shows the improvement in imaging the strongly linear regional faults, as they approach the dome.
The arrow on the dome flanks, shown on both the 2008 PrSDM and 2011 RTM sections on the left, shows how successful the new processing was in improving the image on the steeply dipping flanks.
This benefit, in other similar structures, could be key in evaluating the largely untested play of Triassic Bunter Sandstone reservoir sealed against the steeply, reversed dipping underside flanks of salt domes.
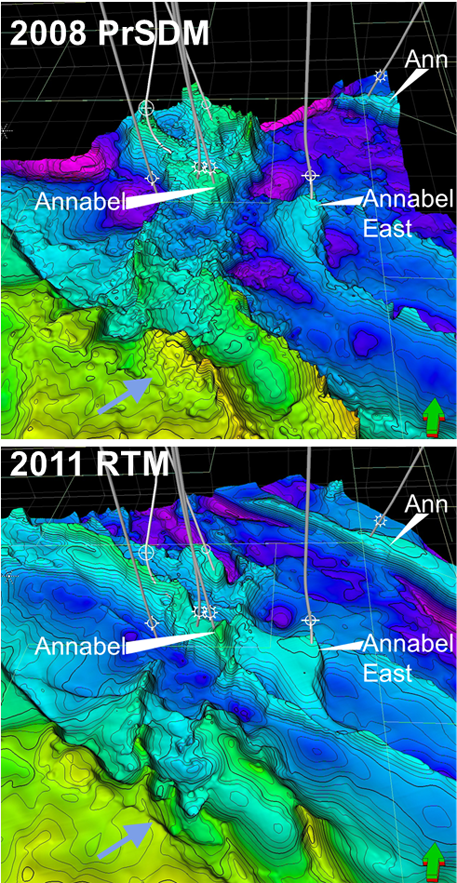
Comparison maps showing the differences in imaging between the
2008 PrSDM and the 2011 RTM across the Annabel East structure.
Back to Project Summary on the Consultancy page